

Log Tracer
Log Tracer provides support for enabling the logs for specific category at specific level and only for specific request. It provides a very fine level of control via config provided as part of HTTP request around how the logging should be performed for given category.
This is specially useful for those parts of the system which are involved in every request. For such parts enabling the log at global level would flood the logs and create lots of noise. Using Tracer one can enable log for that request which is required to be probed.
For e.g. determining what nodes are written for a given POST request can be simply done by including an extra request parameters.
curl -D - -u admin:admin \
 -d "./jcr:content/jcr:title=Summer Collection" \
 -d ":name=summer-collection" \
 -d "./jcr:primaryType=sling:Folder" \
 -d "./jcr:content/jcr:primaryType=nt:unstructured" \
 -d "tracers=oak-writes" \
 http://localhost:4502/content/dam/
Configuration
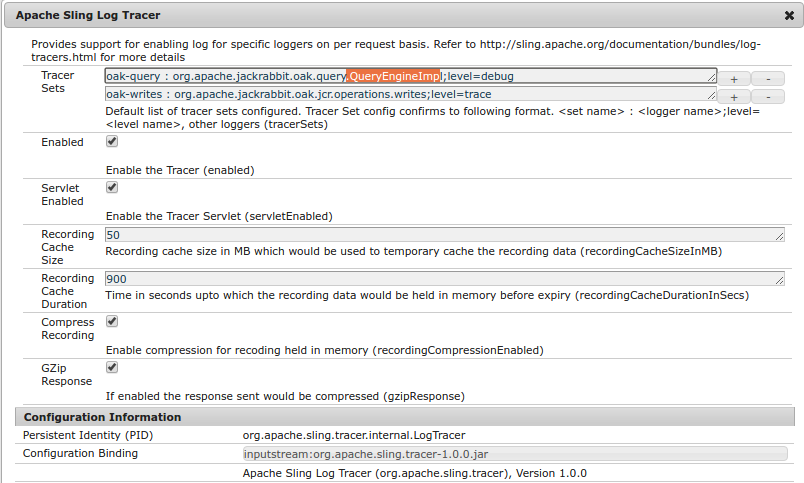
Note that by default Tracer would not be enabled and you would need to save the OSGi config to get it activated
Tracer support two ways to enable logging.
Tracer Sets
Tracer sets are collection of predefined logging categories matching specific area of an application. These can for now be configured as part of OSGi config
oak-query : org.apache.jackrabbit.oak.query.QueryEngineImpl;level=debug
auth : org.apache.sling.auth;level=trace,org.apache.jackrabbit.oak.security
The config is of following format
< set name > : <tracer config>
Where the config is of following format
tracerConfig := loggerConfig ( ',' loggerConfig) *
loggerConfig := loggerName (; attributes)*
attributes := attributeName '=' attributeValue
Currently following attributes are support
level- Either of TRACE, DEBUG, INFO, WARN, ERRORcaller- Used to dump stacktrace of caller. It can have following value (since 1.0.0, SLING-5505)true- Complete call stack for that logger would be included<depth>- Call stack upto depth (integer) would be included e.g. caller=5
caller-exclude-filter- (optional) - '|' separated package prefixes which should not be included in the output. e.g. org.apache.jackrabbit.oak.query.QueryImpl;caller=28;caller-exclude-filter="org.eclipse|org.felix" this would exclude eclipse and felix packages from the resulting stack
Performance Impact
Tracer makes use of Logback TuboFilter to intercept the logging calls and only enable them for those which are enabled via tracer config for the request. The filter is only registered for the duration of that request hence would avoid adding the cost for normal run.
You can also disable the Tracer completely via OSGi config.
Where do logs go
The logs captured are logged at two places
RequestProgressTracker
Sling provides support for recording recent requests which can be accessed via Recent Requests Plugin. It would list down the list of recent request and then on clicking them you can see the logs showed on the UI.
The logging there is done via RequestProgressTracker (intro). By default recent request plugin gets overflown as it captures request even for css, js files. To avoid that you can modify the config as part of Sling Main Servlet config
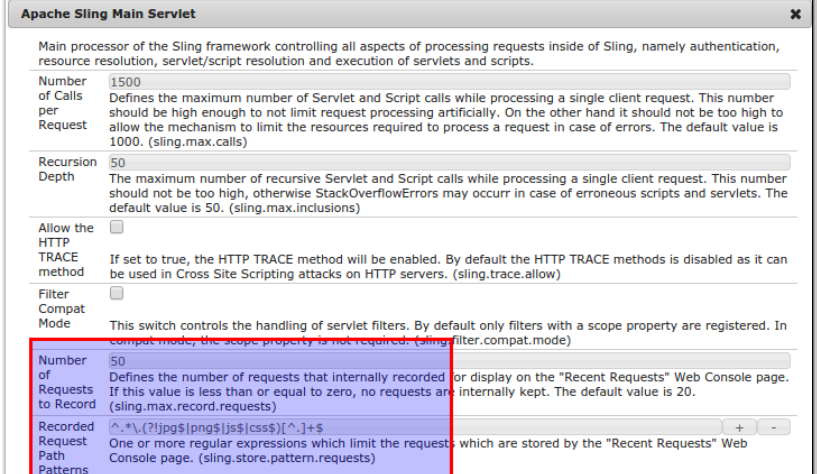
Using a regex like ^.*\.(?!jpg$|png$|js$|css$|woff$)[^.]+$ would avoid noise
With that you can see log entries like below at http://localhost:8080/system/console/requests?index=xxx
132 (2015-05-11 17:39:55) LOG [JCR]  Query SELECT * FROM [granite:InboxItem] AS s where  status='ACTIVE' ORDER BY s.startTime DESC
134 (2015-05-11 17:39:55) TIMER_END{53,/libs/cq/gui/components/endor/badge/badge.jsp#18}
...
1316 (2015-05-11 17:39:56) LOG JCR Query Count 3
1320 (2015-05-11 17:39:56) TIMER_END{1320,Request Processing} Request Processing
Server Logs
Further the logs also go to normal server side logs. By default they would go to the error.log. If you have routed the logs of specific categories to different files then normal Logback logging rules would apply
Usage
Tracing can be done in various ways for a given HTTP request. Tracer looks for following hints as part of request
- Tracer set names - Comma separated list of tracer set names which need to be enabled. e.g.
oak-query, oak-writesetc - tracerConfig - Raw tracing config only used for that specific request
Request Parameters
Param names
tracers- Tracer set namestracerConfig- Tracer config like org.apache.sling.auth;level=trace`curl -u admin:admin http://localhost:4802/projects.html?tracerConfig=org.apache.sling
Above request would turn on debug level logging (default level for tracer) for org.apache.sling category.
curl -D - -u admin:admin \
 -d "./jcr:content/jcr:title=Summer Collection" \
 -d ":name=summer-collection" \
 -d "./jcr:primaryType=sling:Folder" \
 -d "./jcr:content/jcr:primaryType=nt:unstructured" \
 -d "tracers=oak-writes" \
 http://localhost:4502/content/dam/
Above request would create a folder in Assets and for that we have enabled the oak-writes tracer. This would result in following output
2015-05-11 17:30:42,840 INFO  admin [127.0.0.1 [1431345642836] POST /content/dam/ HTTP/1.1] c.a.acs.acs-aem-tools-bundle - Service [4858] ServiceEvent REGISTERED
2015-05-11 17:30:42,846 TRACE admin [127.0.0.1 [1431345642836] POST /content/dam/ HTTP/1.1] o.a.j.o.jcr.operations.writes session-12895- [session-12895] Adding node [/content/dam/summer-collection]
2015-05-11 17:30:42,849 TRACE admin [127.0.0.1 [1431345642836] POST /content/dam/ HTTP/1.1] o.a.j.o.jcr.operations.writes session-12895- [session-12895] setPrimaryType
2015-05-11 17:30:42,849 TRACE admin [127.0.0.1 [1431345642836] POST /content/dam/ HTTP/1.1] o.a.j.o.jcr.operations.writes session-12895- [session-12895] Adding node [/content/dam/summer-collection/jcr:content]
2015-05-11 17:30:42,849 TRACE admin [127.0.0.1 [1431345642836] POST /content/dam/ HTTP/1.1] o.a.j.o.jcr.operations.writes session-12895- [session-12895] Setting property [/content/dam/summer-collection/jcr:content/jcr:title]
2015-05-11 17:30:42,850 TRACE admin [127.0.0.1 [1431345642836] POST /content/dam/ HTTP/1.1] o.a.j.o.jcr.operations.writes session-12895- [session-12895] setPrimaryType
2015-05-11 17:30:42,850 TRACE admin [127.0.0.1 [1431345642836] POST /content/dam/ HTTP/1.1] o.a.j.o.jcr.operations.writes session-12895- [session-12895] setPrimaryType
2015-05-11 17:30:42,856 TRACE admin [127.0.0.1 [1431345642836] POST /content/dam/ HTTP/1.1] o.a.j.o.jcr.operations.writes session-12895- [session-12895] save
Request Headers
Some request like initial authentication processing does not involve Sling MainServlet and hence for those request logging cannot be done to RequestProgressTracker. Instead we can just get logs enabled and route them to normal logging on server side. For that you need to use HTTP header
Sling-Tracers- Set of tracer set namesSling-Tracer-Config- Tracer config
So to enable authentication related logging following request can be sent
curl -D - -d "j_username=admin" \
    -d "j_password=admin" \
    -d "j_validate=true"  \
    -H "Sling-Tracer-Config : org.apache.sling.auth;level=trace,org.apache.jackrabbit.oak.security;level=trace" \
    http://localhost:8080/libs/content/login.html/j_security_check
This would result in following server side logs
2015-05-11 17:34:56,531 INFO  NA [qtp1395423247-193] c.a.acs.acs-aem-tools-bundle - Service [4859] ServiceEvent REGISTERED
2015-05-11 17:34:56,532 DEBUG NA [qtp1395423247-193] o.a.s.a.c.i.SlingAuthenticator - doHandleSecurity: Trying to get a session for null
2015-05-11 17:34:56,532 DEBUG NA [qtp1395423247-193] o.a.j.o.s.a.LoginContextProviderImpl - Found pre-authenticated subject: No further login actions required.
2015-05-11 17:34:56,532 DEBUG NA [qtp1395423247-193] o.a.j.o.s.a.LoginContextProviderImpl - Found pre-authenticated subject: No further login actions required.
2015-05-11 17:34:56,548 DEBUG NA [qtp1395423247-193] o.a.j.o.s.a.u.LoginModuleImpl - Adding Credentials to shared state.
2015-05-11 17:34:56,548 DEBUG NA [qtp1395423247-193] o.a.j.o.s.a.u.LoginModuleImpl - Adding login name to shared state.
Tracer Recording
Since 1.0.0 SLING-5459
Apart from routing the logs to the server logs they can also be stored in memory and accessed in json form from Felix Web Console. By default support for recording is disabled and it needs to be explicitly enabled via OSGi config
Recording features works as explained below
-
Client sends an HTTP request with header
Sling-Tracer-Record set totruecurl -D - -u admin:admin \ -H "Sling-Tracer-Record : true" \ -d "./jcr:content/jcr:title=Summer Collection" \ -d ":name=summer-collection" \ -d "./jcr:primaryType=sling:Folder" \ -d "./jcr:content/jcr:primaryType=nt:unstructured" \ -d "tracers=oak-writes" \ http://localhost:4802/content/dam/ -
Server includes a request id as part of
Sling-Tracer-Request-Idresponse headersHTTP/1.1 201 Created Date: Wed, 27 Jan 2016 07:30:22 GMT Sling-Tracer-Request-Id: 9b5b01f6-f269-47c3-a889-2dc8d4d7938f X-Content-Type-Options: nosniff X-Frame-Options: SAMEORIGIN Location: /content/dam/summer-collection Content-Type: text/html; charset=UTF-8 Transfer-Encoding: chunked -
The logs in json format can then be fetched from server at
/system/console/tracerlike http://localhost:8080/system/console/tracer/9b5b01f6-f269-47c3-a889-2dc8d4d7938f.json.curl -s -D - -H "Sling-Tracer-Record : true" -H "Sling-Tracers : oak-query" \ -H "Sling-Tracer-Config : org.apache.jackrabbit.oak.query" \ -u admin:admin http://localhost:4512/assets.html/content/dam -o /dev/nullBelow is a json output for GET request
{
  "method": "GET",
  "time": 15140,
  "timestamp": 1461574009024,
  "requestProgressLogs": [
    "0 TIMER_START{Request Processing}",
    "0 COMMENT timer_end format is {<elapsed msec>,<timer name>} <optional message>",
    ...
  ],
  "queries": [{
    "query": "/jcr:root/etc/workflow/instances//element(*,app:Workflow)[@status='RUNNING'] order by @startTime descending",
    "plan": "[app:Workflow] as [a] /* property status = RUNNING where ([a].[status] = 'RUNNING') and (isdescendantnode([a], [/etc/workflow/instances])) */",
    "caller": "com.example.WorkflowManager.getWorkflowInstances(WorkflowManager.java:902)"
  }
  ],
  "logs": [{
    "timestamp": 1461574022401,
    "level": "DEBUG",
    "logger": "org.apache.jackrabbit.oak.query.QueryEngineImpl",
    "message": "Parsing xpath statement: /jcr:root/etc/workflow/instances//element(*,cq:Workflow)[@status='RUNNING'] order by @startTime descending",
    "params": [
      "xpath",
      "/jcr:root/etc/workflow/instances//element(*,cq:Workflow)[@status='RUNNING'] order by @startTime descending"
    ]
  }
    ...
  ]
}
JSON output consist of following sections
method- Request methodtime- Time in mills spent in request processing on servertimestamp- Request start timerequestProgressLogs- Sling Request Progress Tracker log for the given requestqueries- List of queries fired along with details aroundquery,planandcalleri.e. from where the query is invokedlogs- List of log entries captured (as enabled by tracer config) for current request
The recordings are held in memory for 15 mins (per default setting) and can be seen listed at http://localhost:8080/system/console/tracer. Look into the OSGi config for more config options around this.
Installation
Download the bundle from here or use following Maven dependency
<dependency>
    <groupId>org.apache.sling</groupId>
    <artifactId>org.apache.sling.tracer</artifactId>
    <version>1.0.0</version>
</dependency>